

Editor’s Note: This article has been updated to reflect new changes in the interactive map.
The Battalion has been tracking details about coronavirus cases in Texas, collecting information around the clock from our own reporting, federal, state and local officials as well as private organizations. Many people are being infected through community spread while not having any known connection to previous cases.
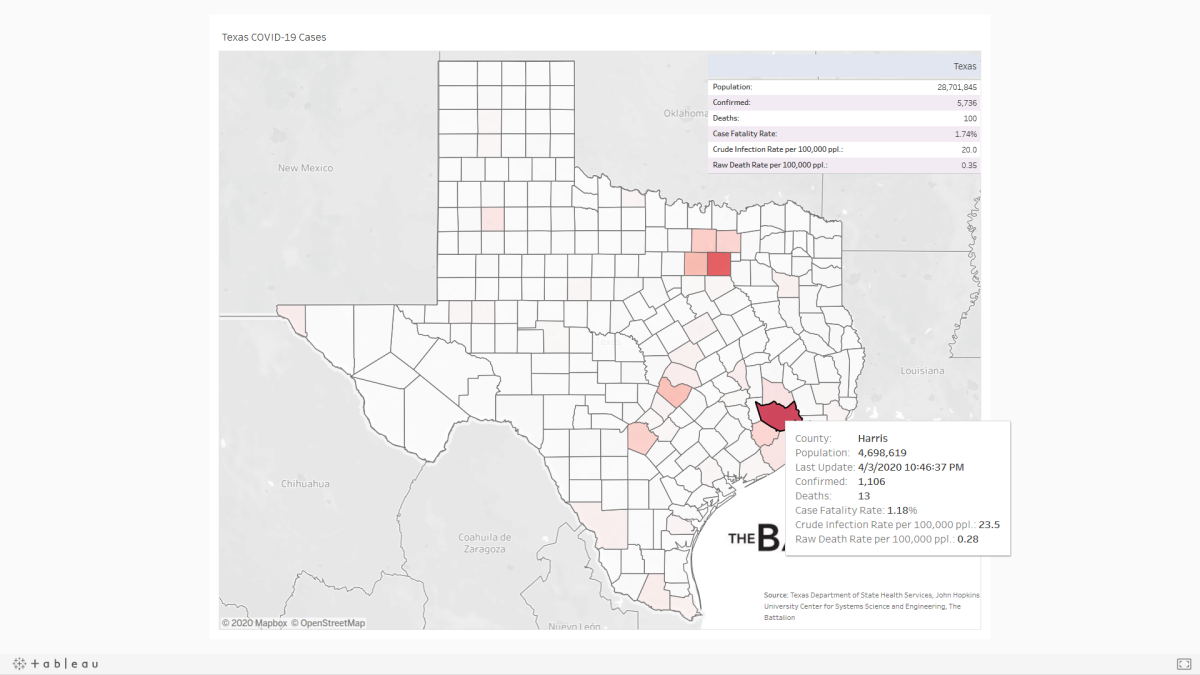
The interactive “Texas COVID-19 Cases” map is part of our concerted effort to bring you up-to-date statistical and geographical information about the spread of the COVID-19 virus in Texas.
Where does the information come from?
As was mentioned before, the data used to build the interactive map above is compiled and cross-referenced from a combination of sources. These are the Texas Department of State Health Services, John Hopkins University Center for Systems Science and Engineering, and The Battalion.
What information does the interactive map contain?
Counties are color-coded with a differing red shading based on the number of total cases reported. The darker the shade, the higher the number of cumulative cases.
When you hover on a county, you will see the name of the county, the date of the last update, in addition to the number of confirmed cases, deaths, case fatality rate, crude infection rate and raw death rate in that county.
The interactive also has a summary table of these measures for the state of Texas — located at the top-right corner or below the map, depending on where you view it.
The number of confirmed cases is different from the number of true cases. Confirmed cases are those who have been tested, usually because they are showing symptoms, and the results have come back as positive for the COVID-19 virus. True cases are the total number who were actually infected at any time, including both people who do not show any symptoms or are symptomatic but have not been tested. Because of the problems with testing and the credible possibility that many people may be asymptomatic, the number of true cases may be significantly higher.
The COVID-19 deaths are those people who have been confirmed to have contracted the virus and subsequently died of related symptoms. The case fatality rate is the percentage of confirmed cases that result in death for infected persons. This is not the same as the infection fatality rate, which is the percent of diagnosed and undiagnosed individuals who die from the disease. The latter reflects the actual risk of dying if infected. The former varies by region and over time, and is influenced by the volume of testing, healthcare system quality, treatment options, time since initial outbreak and population characteristics. During outbreaks, the case fatality rate typically starts off significantly higher than the actual infection fatality rate, and should then theoretically converge over time to roughly within range of the infection fatality rate as more testing is completed. The infection fatality rate for COVID-19 is yet to be conclusively determined.
The crude infection rate is the ratio of confirmed cases over the total population. The “true” infection rate is the number of diagnosed and undiagnosed people after once gain controlling for population. Like the infection fatality rate, the real infection rate will not be estimated for quite some time. The raw death rate is the number of disease deaths, adjusting for the size of a specific population. The raw death rate does not take into account the age, sex distribution or overall health of a given population.
Unfortunately, as of now, the map does not show the number of active cases nor the number of recoveries. Since roughly 81 percent of COVID-19 infections are mild while only about 19 percent of cases require any form of hospitalization, the number of confirmed cases and deaths may paint an incomplete picture of the progress of the epidemic. We were unable to find any reliable source for this information on a county level. If this data becomes readily available in the future, we will update the map accordingly.
What’s the situation in Texas?
The COVID-19 pandemic has infected 3,809 people in the state. As of Tuesday March 31, 54 people have died — a raw case fatality rate of around 1.42 percent. Also, the virus has been detected in 136 counties, as the map above shows.
As of this writing, Harris County has the highest number of cumulative confirmed cases with 680, and Dallas County is close behind with 631. 118 counties do not have any confirmed cases.
The county with the highest number of cumulative deaths is Dallas County — 13 deaths. The next highest number of deaths is Bexar and Harris counties, each with six deaths.
Please note that care should be taken when interpreting all case numbers from county to county. All else being equal, we would expect more total number of confirmed cases in, say, Tarrant County — which has a population of approximately 2 million people — than Midland County which has a population of about 150,000 people. The same goes for the total number of deaths: depending on the population of the county as well as relative age and distribution of people with pre-existing health conditions, we would expect that a more populous, older or “sicker” county would have more deaths on average than a less populous, younger or “healthier” county. This is what our crude infection rate and raw death rate attempt to do, at least partially, regarding the population only.
What’s happening in Brazos County?
The number of known cases in Brazos County continues to grow. As of Tuesday afternoon, at least 53 people in the county have tested positive for the virus and two patients with the virus have died.
When will the map be updated?
The map will be updated twice daily at 11 a.m. and 11 p.m. Please check back at these times for the latest information.
If you have any questions about the map, are having trouble using it or spot any issue, please let us know at [email protected] or message us on Twitter or Facebook.
Click here to go to the interactive map.


Aggies across South Texas left reeling in wake of unexpectedly dangerous storm


Coming out of high school, Cooper Flagg has been deemed a surefire future NBA talent and has been compared to superstars such as Paul George...


In his various positions, Professor Emeritus Bob Rogers laid down the stepping stones that student journalists at Texas A&M walk today, carving...


As I wandered somewhere in between the Brazilian carnival dancers and luchador masks that surrounded Kyle Field in the hours before the June...

What is the Battalion’s ‘Texas COVID-19 Cases’ map?
March 31, 2020
Battalion COVID-19 Map Interactive 3
Donate to The Battalion
Your donation will support the student journalists of Texas A&M University - College Station. Your contribution will allow us to purchase equipment and cover our annual website hosting costs.
More to Discover